

#1 Retention Is the Center of Growth

Retention is one of those ideas that everyone nods along to. Of course retention matters. Of course you want users to come back. Yet in practice, retention is consistently misunderstood, mismeasured, and deprioritized — until it's too late.
Most teams treat retention as a metric, but it's really the output of your entire product and growth system. It influences acquisition, monetization, and company value. Strong retention means compounding growth; weak retention means growth efforts are wasted.
In this first part, we'll unpack what retention really means and how to measure it without fooling yourself. In Part 2, we'll explore how retention reshapes the entire growth engine — from acquisition loops to payback periods.
What Retention Actually Means
At its simplest, retention is the percentage of users who try your product, find value, and return to perform a specific action within a given period.
That definition sounds obvious, but the details matter. For consumer products, retention means the percentage of users who perform a meaningful action within a specific time frame — daily, weekly, or monthly, depending on usage. For SaaS and subscription businesses, it refers to metrics like revenue retained, expansion revenue, or net revenue retention over time.
What matters isn't the specific formula, but whether your retention metric reflects real value being delivered. "Opening the app" is rarely enough. Retention should be anchored in an action that embodies your product's core value.
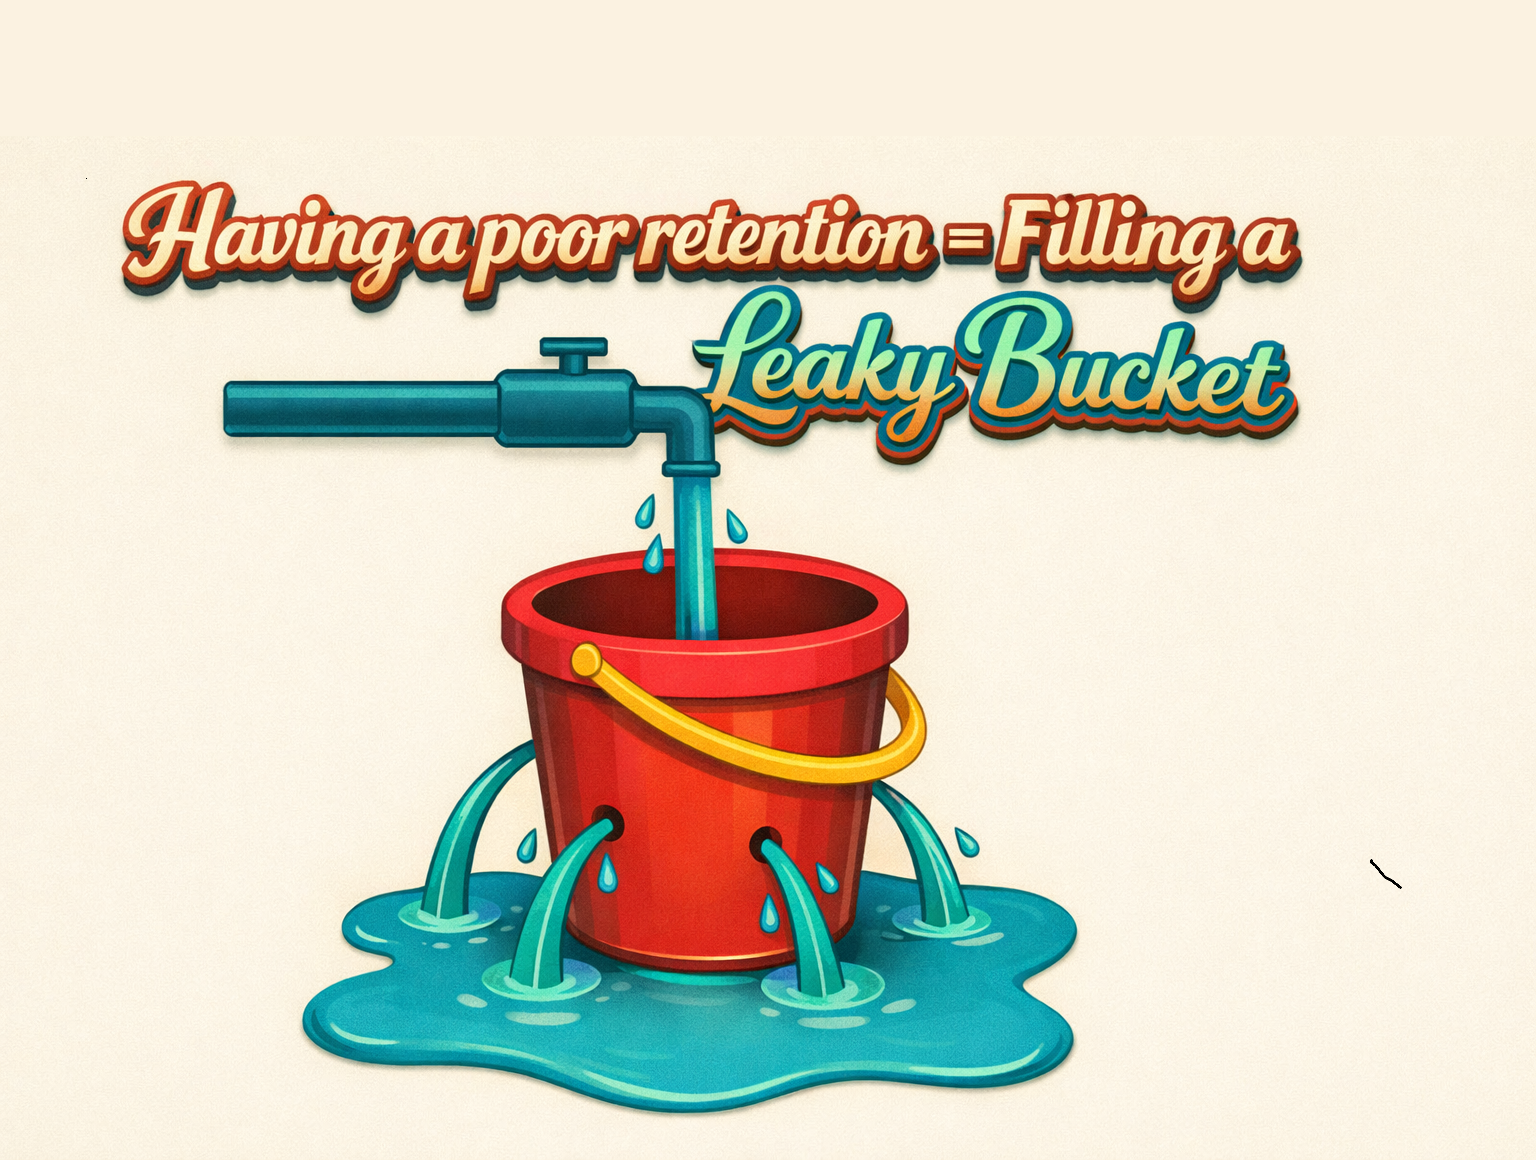
This is also why retention should come before growth spending. If users don't stick, scaling acquisition just accelerates churn. You burn through your addressable market without building a durable user base. Growth without retention isn't growth — it's leakage. A bucket leaking while you're trying to fill it.
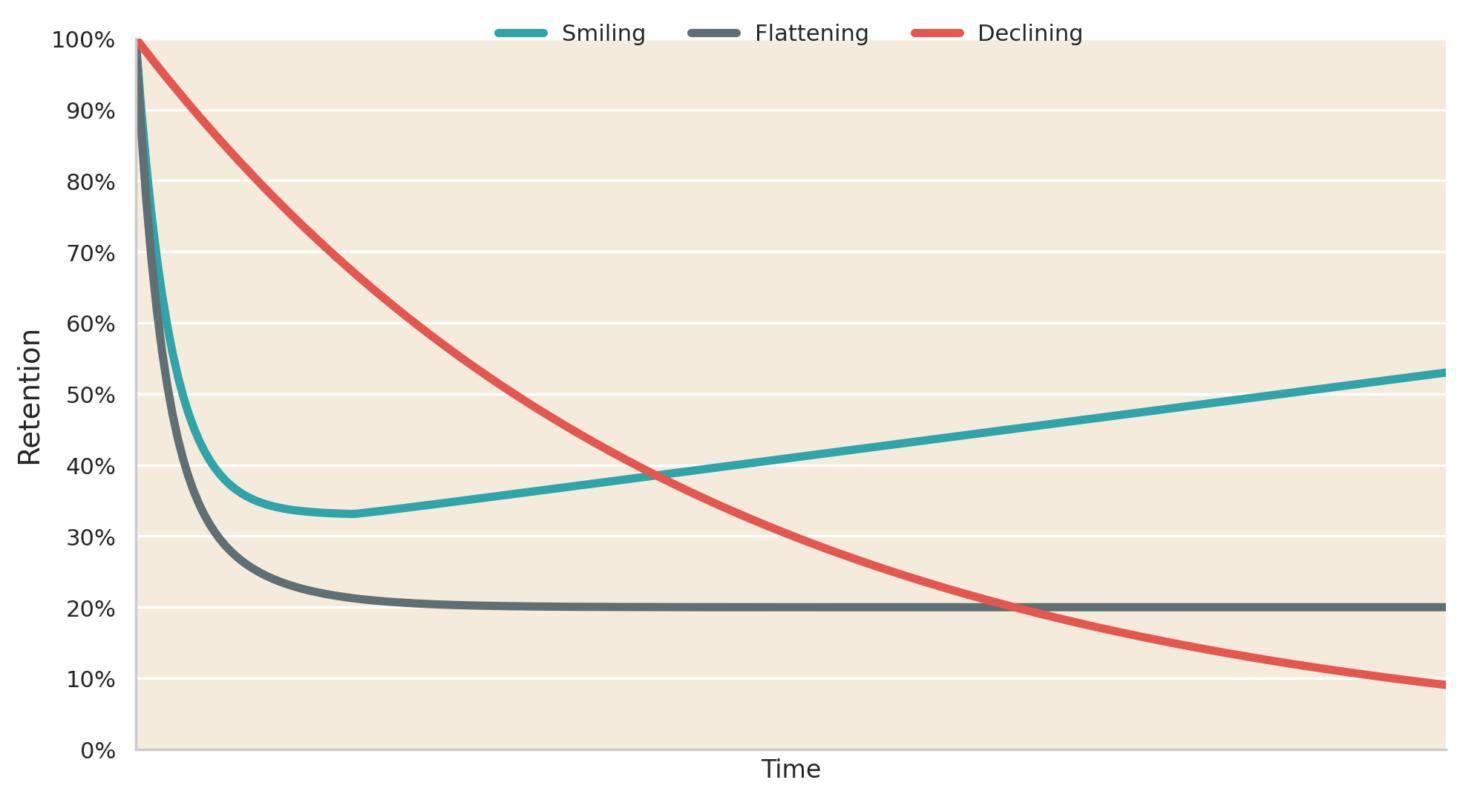
The Three Shapes of Retention
When you plot retention over time, most products fall into one of three patterns.
Decline curve: Retention decreases steadily, eventually approaching zero. Almost all users stop returning over time. This is the most dangerous pattern, signaling a fundamental product–market fit problem. Even strong growth tactics won't help here — the core value proposition needs fixing.
Flattening curve: An initial sharp decline followed by a plateau as a portion of users continues finding lasting value while the rest churn quickly. Most healthy products exhibit this pattern. The key question isn't whether retention drops early — it almost always does — but how high the long-term plateau settles. Real product work pays off in raising that plateau.
Smiling curve: The rarest pattern. Retention initially drops, then improves over time as network effects, habits, or ecosystem value take hold. These products often become industry leaders because their value compounds over time.
Understanding which curve you're on is essential. It tells you whether to fix fundamentals or scale growth.
Measuring Retention Without Lying to Yourself
Retention is easy to measure badly, and doing so is deceptively comforting.
The first trap is choosing the wrong time window. Daily products should be measured daily. Weekly products weekly. Monthly or quarterly tools should follow their natural cadence. If your time window doesn’t match how people actually use the product, your retention numbers won’t mean much.
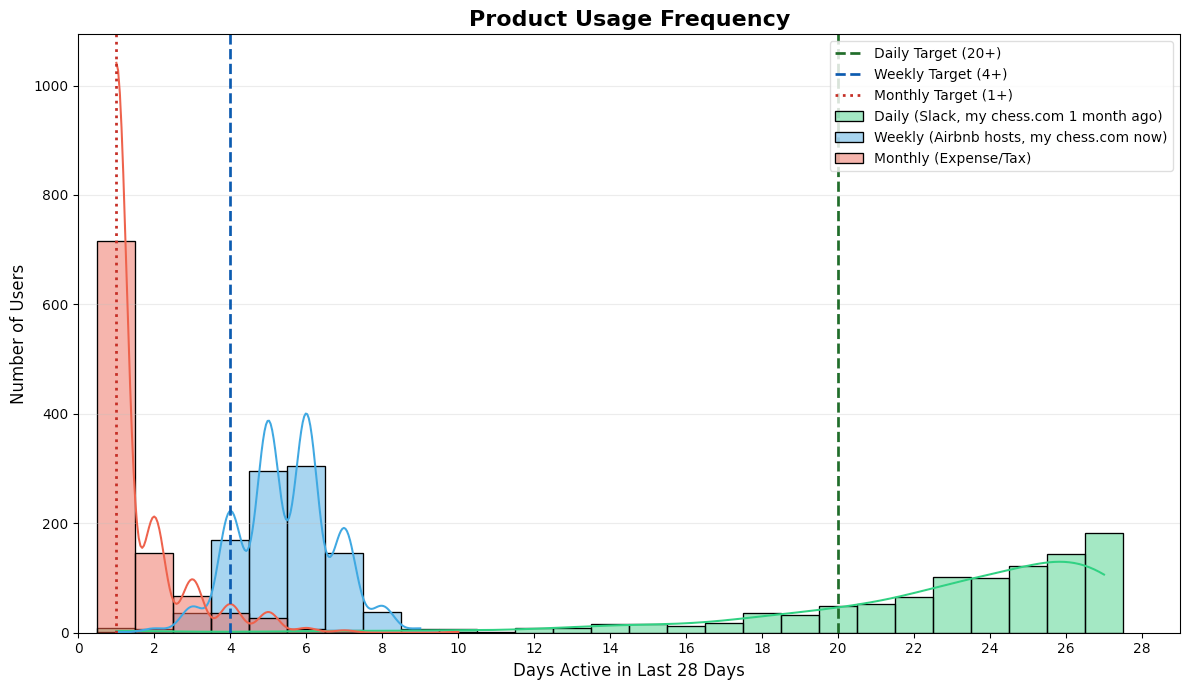
The next figure visualizes the distribution of users by their active days over the last 4 weeks (L28), helping us identify the 'natural usage frequency'—Daily, Weekly, or Monthly—so we can set appropriate retention benchmarks for different products or specific feature use cases.
Different products and use cases have distinct natural frequencies: Airbnb guests typically book yearly for vacations, while hosts engage weekly to manage rentals, and Slack users connect daily for work. However, usage patterns can also shift for a single user—for instance, last month I lost my 64-day streak on Chess.com, dropping from a 'Daily Active User' to a 'Weekly Active User' after playing just 8 games.
The second trap is choosing the wrong event. Retention must measure value experienced, not just surface activity — the "heartbeat event" of your business. A completed ride is far more meaningful than an app open, just as a sent message is better than a login. An app open alone doesn't prove you've created value. By tracking the wrong metric, you risk optimizing for "empty sessions" — driving high traffic without delivering meaningful results, which ironically creates a frustrating experience rather than a sticky one.
However, even with the right event and frequency, looking at your entire user base as a single number can be misleading.
This is where cohort analysis becomes critical — a precise tool for surfacing problems that averages ignore. You might have a seemingly healthy overall retention rate, but that average is often weighted by older, loyal users. It could be masking a recent cohort you're failing to retain. Identifying and fixing these specific leaks is often where your biggest uncaptured growth opportunities lie.
This perspective is especially powerful when analyzing tenure in subscription services. Cohort data often reveals a clear "survival" dynamic: if you can retain a user through the volatile early stages of their lifecycle (e.g., keeping them engaged for the first 3 months), their likelihood of churning drops significantly. Cohort tables force you to focus on these critical early battlegrounds rather than hiding behind a comfortable aggregate average.
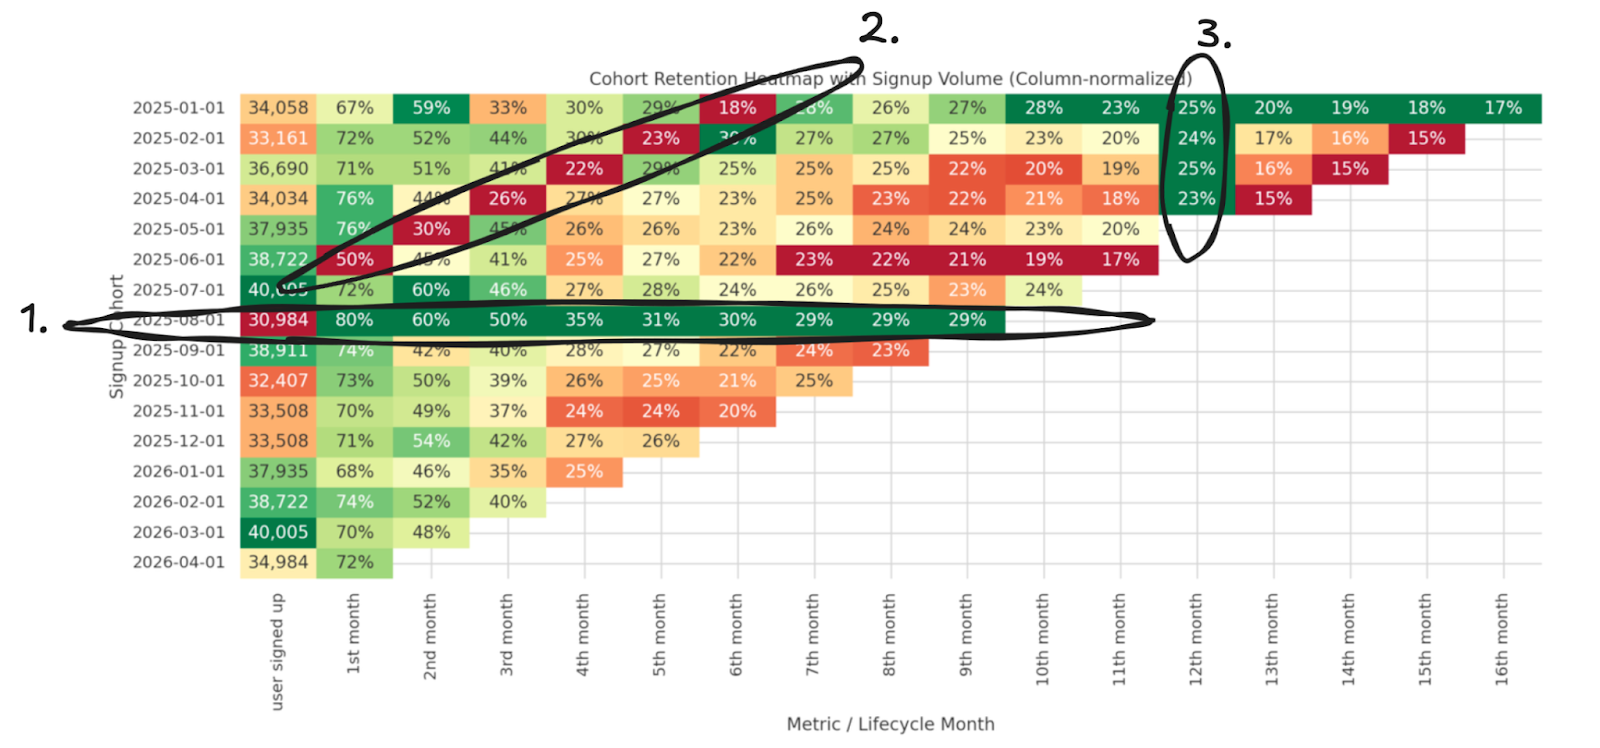
How to Read Cohort Retention Tables ("Triangle Charts")
Now that we understand the importance of cohorts, we need a way to visualize them. The triangle retention chart is designed for exactly this purpose. It visualizes user behavior over time, letting you instantly diagnose why retention is moving. Instead of guessing whether a drop is due to a bad product update, a weak campaign, or a seasonal trend, this chart separates these variables. By laying out cohorts side by side, you can distinguish between problems that affect new users specifically (onboarding issues) and problems that affect everyone at once (outages).
A triangle retention chart is a cohort-based view of retention over time, useful for regular monitoring:
- Rows: Each row represents a time-based cohort (e.g., users who signed up in the same week or month).
- Columns: The first column shows the initial cohort size; the following columns show what percentage of that cohort is still active after 1, 2, … N periods.
By reading the chart in different directions, you can isolate specific business drivers:
- Horizontal patterns reflect cohort-specific effects, such as acquisition campaigns or market expansions. For example, the August 2025 cohort might have the smallest size but significantly stronger retention — suggesting that while volume was low (perhaps due to reduced marketing spend), user quality was much higher.
- Diagonal patterns usually indicate events affecting all users simultaneously, regardless of when they joined. This often points to feature launches, bugs, or external shocks — such as a sharp diagonal drop from a widespread AWS outage affecting retention across all cohorts.
- Vertical patterns are common in subscription or trial-based products and often align with specific tenure milestones. These columns reveal the "survival" moments — such as the drop-off after a 30-day trial ends or a churn spike during annual renewals.
What's Next
Now that we've established what retention really means — and, just as importantly, how to measure it honestly — the natural question is: so what? Why does retention deserve all this attention over other growth levers?
In Part 2, we'll dive into the growth economics of retention. Using LTV, CAC, payback periods, and a deterministic growth simulation, we'll show why even a modest 2% improvement in retention can outperform a 10% boost in acquisition — and why retention is the single highest-leverage lever in your growth engine.
No spam, no sharing to third party. Only you and me.